
The lesson
Read each section in order, work through every example on paper, then use the practice problems and quick check at the bottom.
Statistical questions
A statistical question expects answers that vary. "How tall are the kids in our class?" is statistical because heights differ. "How tall is the door?" is not - it has one answer.
Measures of center
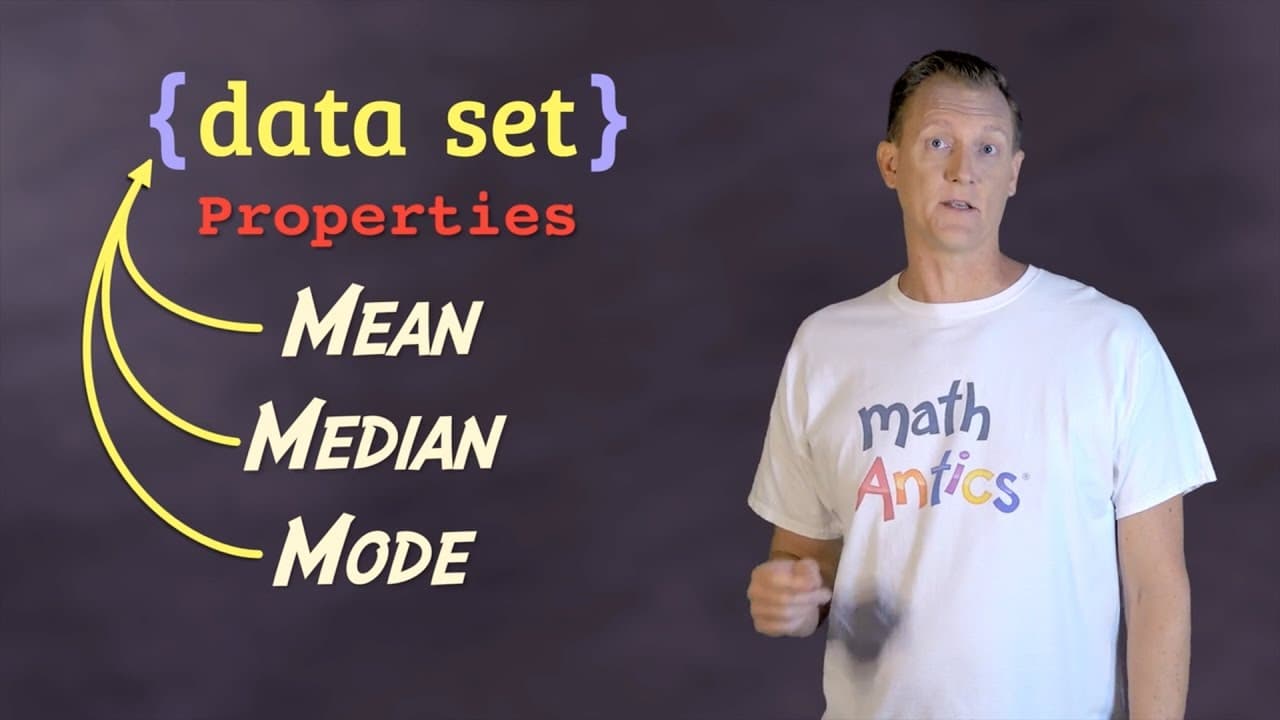
Three numbers describe the center of a data set. Mean is the average. Median is the middle value when the data is sorted. Mode is the value that appears most often.
Find the mean of 4, 7, 7, 9, 12.
- 1Add them up: 4 + 7 + 7 + 9 + 12 = 39.
- 2Divide by how many there are: 39 ÷ 5 = 7.8.
Why this matters
When an answer varies - and how to describe the middle of the data.
These ideas show up on homework, quizzes, and the next unit in this grade. Getting comfortable here saves time later when the problems stack more steps together.
Common mistakes to avoid
Rushing to the answer without writing steps. Clear work helps you catch mistakes and shows your reasoning.
Re-reading the question too quickly. Underline what you are solving for before you start calculating.
Key ideas from this lesson
- Statistical questions
- Measures of center
Video walkthroughs
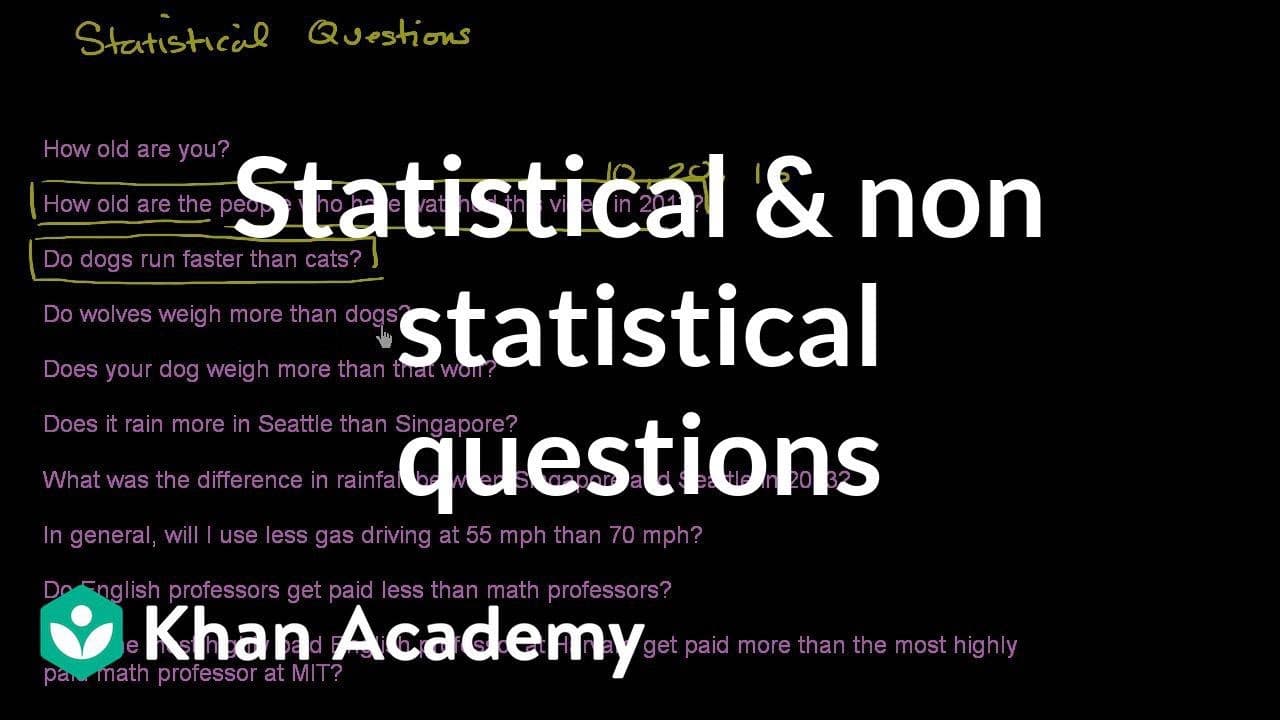
Statistical & Non-Statistical Questions
Learn which questions expect many different answers.
Watch on YouTube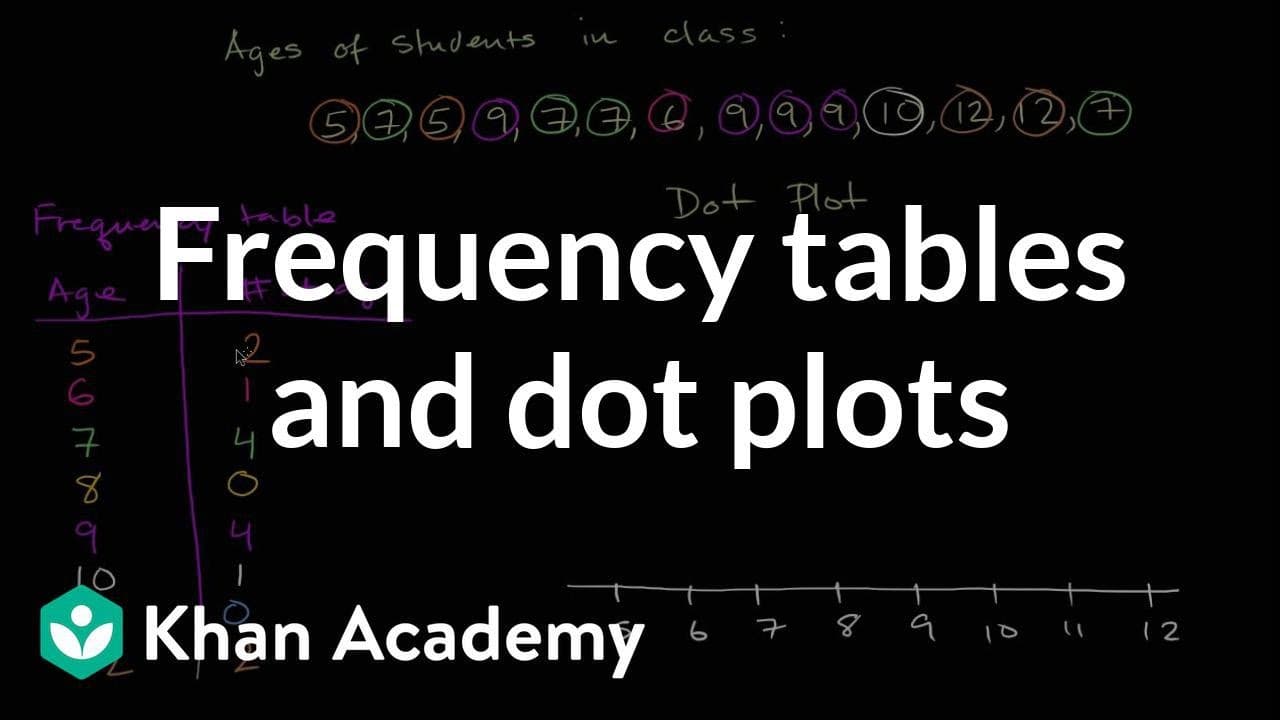
Frequency Tables and Dot Plots
Organize data and see where values cluster on a dot plot.
Watch on YouTube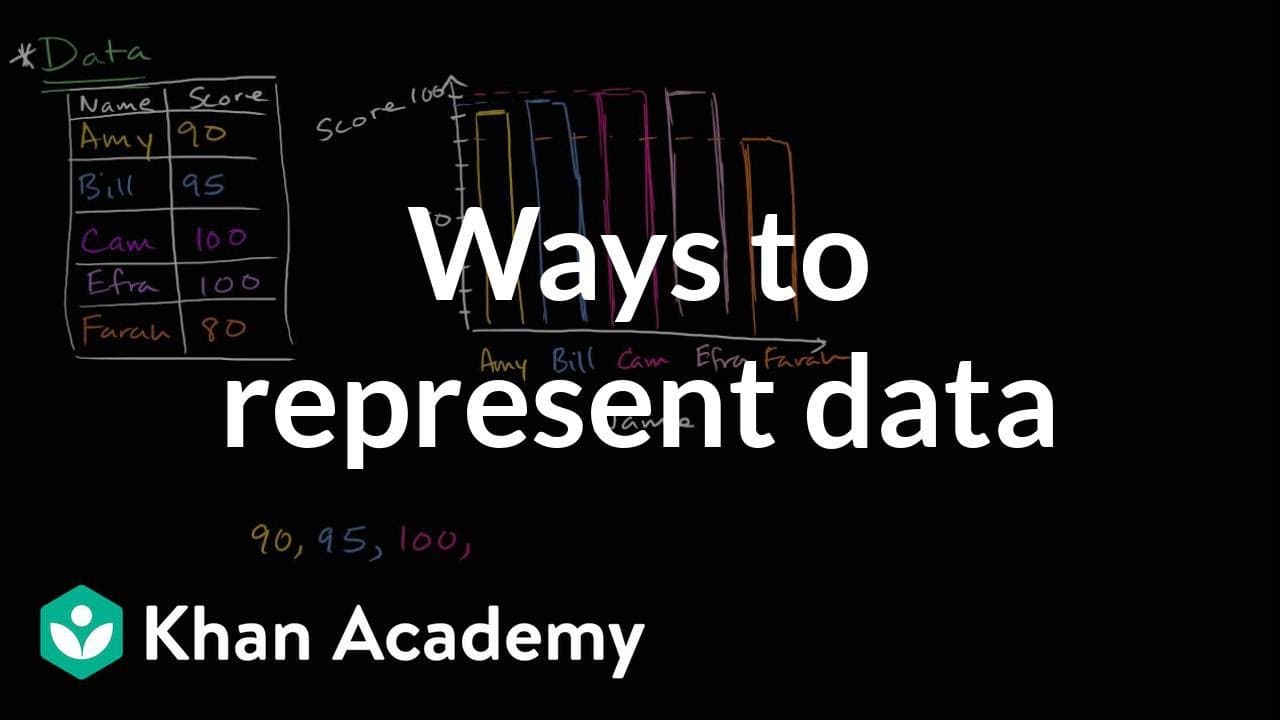
Ways to Represent Data
Compare tables, dot plots, and other displays for a data set.
Watch on YouTubePractice
For each problem: write your work in the box, type your answer, and check it. If you are stuck, reveal the solution one step at a time. Do not skip straight to the final answer.
Exercise 1
Try it yourselfIs "How many pets does each student in our class have?" a statistical question?
Step-by-step solution
- 1Different students will have different answers.
- 2The data varies, so it is statistical.
Exercise 2
Try it yourselfFind the mean of: 6, 8, 10, 12.
Step-by-step solution
- 1Sum: 6 + 8 + 10 + 12 = 36.
- 2Mean: 36 ÷ 4 = 9.
Exercise 3
Try it yourselfFind the median of: 11, 3, 7, 9, 5.
Step-by-step solution
- 1Sorted: 3, 5, 7, 9, 11.
- 2The middle value is 7.
Exercise 4
Try it yourselfFind the mode of: 4, 7, 7, 9, 7, 12.
Step-by-step solution
- 17 appears most often (three times).
- 2The mode is 7.
Exercise 5
Try it yourselfTest scores: 82, 90, 76, 90, 88. Find the mean and median.
Step-by-step solution
- 1Mean: (82+90+76+90+88) ÷ 5 = 426 ÷ 5 = 85.2.
- 2Sorted: 76, 82, 88, 90, 90. Median = 88.
Quick check
Answer all questions. Retake the quiz until you feel confident before moving on.
Statistical Questions & Center
Question 1 of 5
Find the median of: 4, 7, 2, 9, 5